Recently, The Astrophysical Journal, an international journal of astrophysics, published the latest research results of the Fuxian Lake Solar Observation and Research Base of the Yunnan Observatories of the Chinese Academy of Sciences. They depicted a complete physical image of the anomalous heating in the upper atmosphere of the Sun (the solar corona and the solar chromosphere).
The enigma of the corona's anomalous heating stands as one of the eight challenges in modern astronomy. Similarly, the anomalous heating of the chromosphere continues to baffle solar physicists. Observations gleaned from large telescopes and satellites have revealed potential magnetic activities that could be the cause of this heating. Theoretical research has proposed various heating modes, yet none have been definitively proven to be the cause. As it stands, our understanding of how the Sun's upper atmosphere is heated remains incomplete.
This study charts a new course, departing from the traditional cause-to-effect approach of past research. Instead, it starts from the effect and traces its way back to the cause. The journey begins with an examination of the upper atmosphere’s characteristics, followed by the identification of correlations with various magnetic fields, the only known source capable of supplying the energy needed for heating the upper atmosphere.
The research considers the entire upper atmosphere as a whole that has been experiencing abnormal heating and maintaining abnormally high temperatures for a long time. Consequently, the most suitable and necessary research method involves analyzing long-time series observations of the full-disk chromosphere and corona.
For the first time, this study provides a clear answer to the question of how the upper atmosphere is abnormally heated. This clarity comes from the analysis of the long-term observations of the global chromosphere in the Ca II K line and the global corona in the coronal green line.
The research reveals that the quiet chromosphere's main heat source is the network magnetic fields, and the magnetic configuration of their canopy structures greatly prevents charged particles, thermal energy, and some waves from escaping from the top of the chromosphere. The butterfly-shaped active chromosphere draws its heat from the magnetic fields of active regions and ephemeral regions, as well as from the downward propagation of energy generated by them in the corona. Notably, the magnetic fields in ephemeral regions contribute significantly more to the heating of the active chromosphere than those in active regions. The heating of the quiet chromosphere forms the main component of the entire chromosphere's heating.
In a similar vein, the quiet corona is mainly heated by the network fields. The butterfly-shaped active corona draws its heate from the magnetic fields in active regions and ephemeral regions.Here too, the magnetic fields in ephemeral regions contribute significantly more to the heating of the active corona than those in active regions. The active corona receives more heat than the quiet corona.
The heating of the magnetic fields in active regions and ephemeral regions results in a butterfly-shaped spatial distribution of the active chromosphere and the active corona. This heating process exhibits a long-term evolution characteristic that is in phase with the solar activity cycle. Conversely, the heating of the network fields leads to a long-term evolution of the entire background (quiet) chromosphere and the background (quiet) corona, which is opposite to the solar cycle.
This work is supported by the National Natural Science Foundation of China, the Yunnan Ten-Thousand Talents Plan (the Yunling-Scholar Project), the "Yunnan Revitalization Talent Support Program" Innovation Team Project, and the project supported by the specialized research fund for state key laboratories.
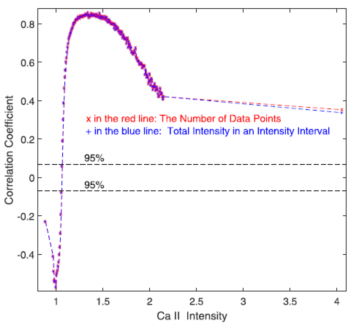
Figure 1, relationship between different intensities of the chromosphere and the sunspot activity cycle. The red dots represent the number of points within a range of Ca II K-line intensity, while the blue dots represent the total intensity within a range of Ca II K-line intensity. Image by Li.
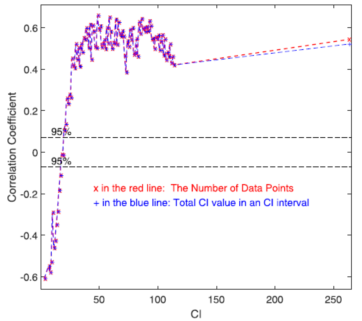
Figure 2, relationship between different intensities of the corona and the sunspot activity cycle. The red dots represent the number of points within a range of the coronal green line intensity, while the blue dots represent the total intensity within a range of the coronal green line intensity. Image by LI.
Contact:
LI Kejun
Yunnan Observatories, CAS.
lkj@ynao.ac.cn