Researchers at the Fuxian Lake Solar Observation and Research Base of the Yunnan Observatories have revealed a Janus‑like duality in solar activity by analyzing full‑disk super‑synthetic magnetograms. The paper, titled The Split Janus‑faced Sun: Magnetic Rhythm and Duality in the Solar Cycle, was published in Research in Astronomy and Astrophysics.
The solar activity cycle is a cornerstone of heliospheric physics, yet its driving mechanism—the solar dynamo—remains one of the central unsolved mysteries in solar physics (ranked 51st among the 125 scientific questions listed by Science magazine). Although it has long been known that the Sun's surface hosts large‑scale sunspot magnetic fields as well as small‑scale network and ephemeral region fields, and that magnetic fields at different scales exhibit complex phase relationships with the solar cycle (some in phase, some anti‑phase, and some uncorrelated), a systematic classification of full‑disk magnetic fields to reveal their overall evolutionary behavior has been lacking.
This study identifies a critical threshold (5.29 G) in the Sun's full‑disk magnetic field, which splits solar magnetic activity into two phase‑opposite Janus faces: a "strong" face and a "weak" face. At low latitudes, the activity cycle of the strong field (sunspot cycle) appears as the dominant Janus face—what is conventionally known as the solar activity cycle—while the weak field exhibits an anti‑phase cycle as its hidden face. At high latitudes, the Janus faces reverse their behavior completely relative to those at low latitudes. Consequently, the long‑term evolution of the full‑disk magnetic field gives rise to a previously unrecognized "Janus cycle" that permeates the entire solar atmosphere.
This discovery not only explains why some long‑term activity phenomena yield contradictory statistical results, but also provides a new physical picture for understanding the origin, evolution, and impact of solar magnetic fields on the heliospheric environment — namely, that there are two solar activity cycles at high and low latitudes.
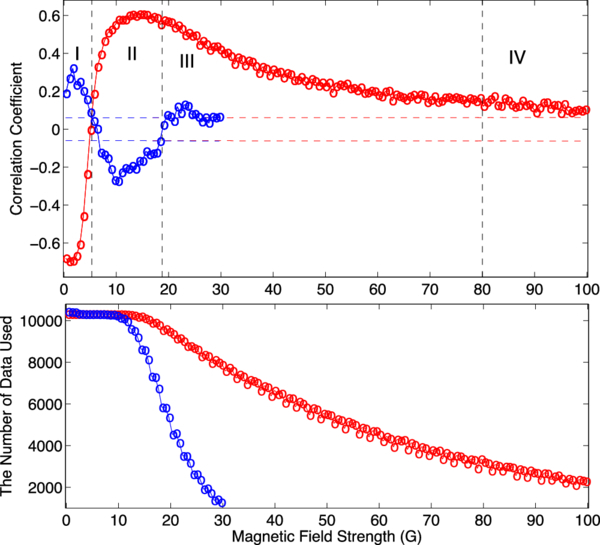
Figure 1: The upper figure: Pearson correlation coefficients between daily magnetic field strength values within different intensity ranges and daily sunspot numbers in low-latitude (red circles) and high-latitude (blue circles) regions. The vertical black dotted line divides the magnetic elements on the solar surface into four magnetic intensity regions (labeled as I, II, III, and IV), corresponding to the weak to strong magnetic intensity ranges. II, III, and IV can be combined into one category. The lower figure: The number of data points used to calculate the correlation in the upper figure. Image by LI.
Contact:
LI Kejun
Yunnan Observatories, CAS
e-mail:lkj@ynao.ac.cn