A research team led by Dr. ZHOU Yian, a postdoctoral researcher at the Yunnan Observatories of the Chinese Academy of Sciences, in collaboration with Professor YAN Xiaoli, has conducted a detailed spectroscopic case study of four long-duration explosive events (EEs) in the solar transition region. Using high-resolution observations from the Interface Region Imaging Spectrograph (IRIS), the team uncovered the fine spectral evolution of these events. The findings were published in The Astrophysical Journal.
The solar transition region serves as a critical boundary layer between the chromosphere and the corona. Small-scale explosive events occurring there often exhibit non-Gaussian spectral line profiles and plasma motions reaching speeds of up to hundreds of kilometers per second, commonly interpreted as signatures of magnetic reconnection. However, the long-term spectral evolution of such events has remained poorly understood.
Focusing on four EEs (EE1–EE4) observed on February 10, 2023, each lasting 20 to 25 minutes, the team performed multi-component Gaussian fitting of the Si IV 1403 Å line profiles. This allowed them to track the spectral evolution throughout the entire lifetime of each event. The results revealed three recurring spectral morphologies: bilateral wing enhancement, exclusive red-wing enhancement, and exclusive blue-wing enhancement. Among these, bilateral enhancement was the most common. Throughout the events, sustained and evolving bidirectional flows were observed, with high-velocity components (exceeding 100 km/s) emerging in the late phases. These features are interpreted as direct evidence of ongoing or recurrent magnetic reconnection. In contrast, the simultaneously observed flare ribbons and loop structures exhibited unidirectional redshifts.
The study further highlights that significant non-Gaussian wing enhancement, rather than high speed alone, is the defining spectroscopic signature of explosive events. This finding provides new observational constraints for understanding small-scale explosive phenomena in the solar transition region.
This work was supported by the Strategic Priority Research Program of the Chinese Academy of Sciences, the National Natural Science Foundation of China, the Yunnan Key Laboratory of Solar Physics and Space Science, the Department of Science and Technology of Yunnan Province, and the Yuning Scholar Project of Yunnan Province.
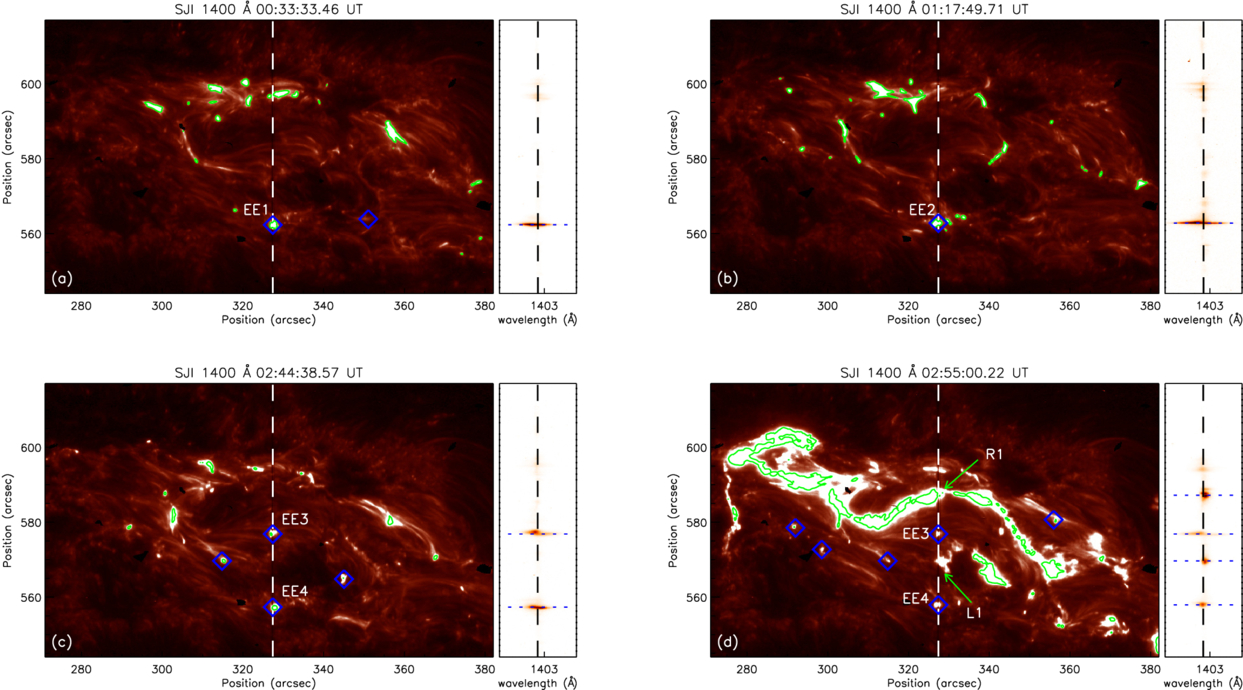
Figure 1. Overview of TR EEs in NOAA AR 13213, observed with IRIS SJIs at 1400 Å and the corresponding Si iv 1403 Å spectra near 00:33:33 UT, 01:17:50 UT, 02:44:39 UT, and 02:55:00 UT. In each SJI panel, the vertical white dashed line indicates the slit position. EE1–EE4 and the blue diamond denote the locations of EEs. Green contours outline regions with intensities exceeding 5% of the maximum within the field of view. In the spectral panels, vertical black dashed lines mark the line center of Si iv 1403 Å, while horizontal black dashed lines indicate the positions of EEs, flare ribbons, and loop structures. Image by ZHOU.
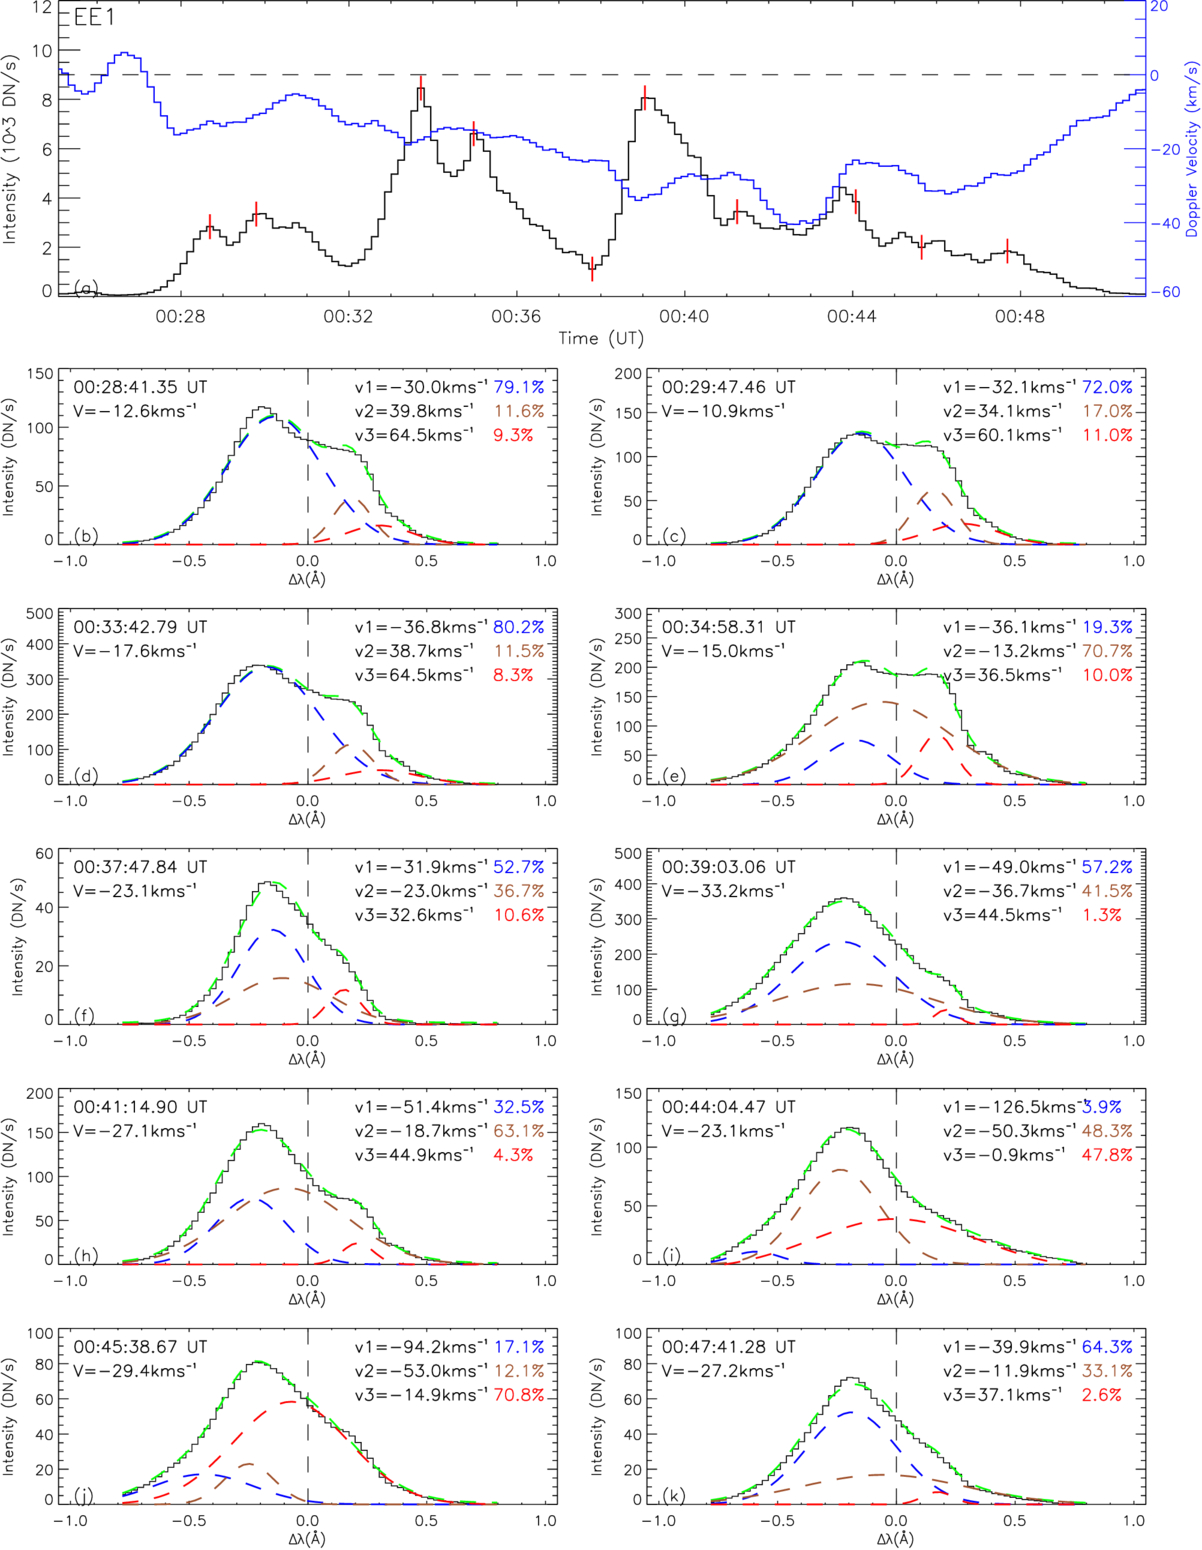
Figure 2. Panel (a): time evolution of the integrated intensity (black curve) and Doppler velocity (blue curve) of Si iv 1403 Å line. The short vertical red lines indicate the specific position marked by blue diamonds. Panels (b)–(k): Si iv 1403 Å line profiles of EE1. In each panel, the vertical dashed lines mark the rest wavelength of the Si iv 1403 Å line. Green dashed curves indicate the composite Gaussian fits, while blue, red, and orange curves denote the individual Gaussian components. The global velocity, v, is derived from the centroid of the fitted profile. The velocities v1, v2, and v3 correspond to the Doppler shifts of each Gaussian component. Image by ZHOU.
Contact:
ZHOU Yian
Yunnan Observatories, CAS
e-mail:zhouyian@ynao.ac.cn